"Our imagination is stretched to the utmost, not, as in fiction, to imagine things which are not really there, but just to comprehend those things which are there."
Richard Feynman, The Character of Physical Law (1965)
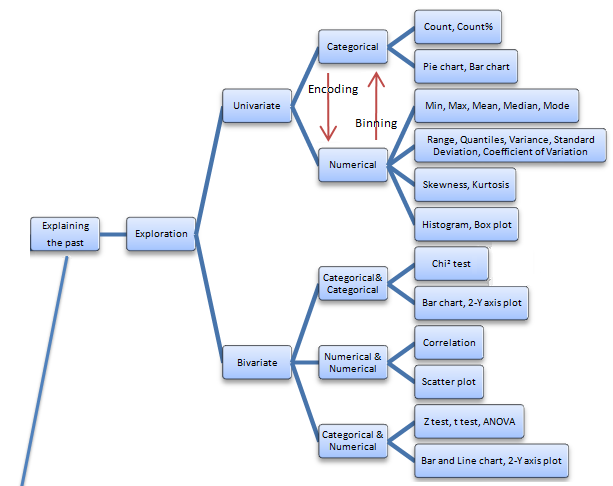
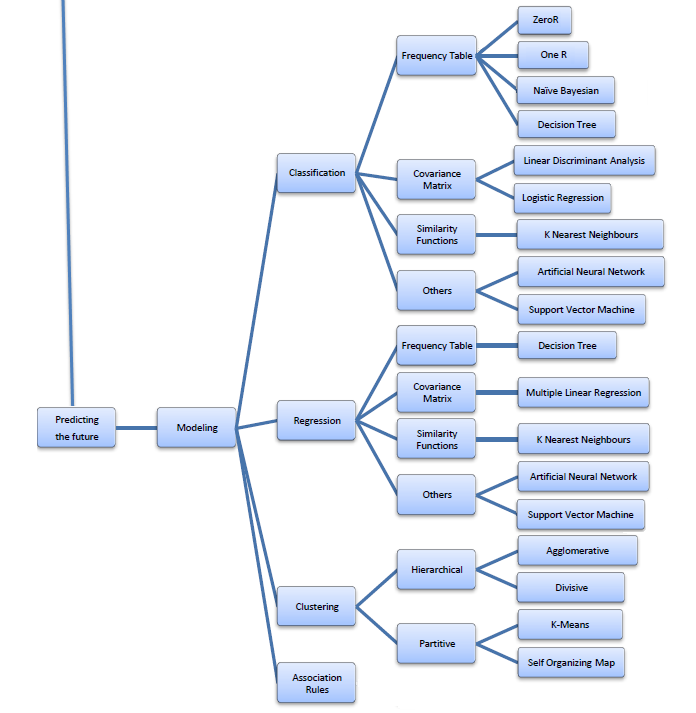
You don't need terabytes of structured information to begin seeking patterns in data, but it helps. Today's post discusses pattern identification in data sets, in particular it explores common fallacies which are rampant in the field of datamining.
Experimenter's Bias
The aspiration of data scientists is to banish false assumptions which conceal true patterns. Each collection of data has a story to tell, and it is our charge and duty to best extract each set's essential character.
It is human nature to embellish these stories and identify presumed patterns, even without sufficient supporting evidence (experimenter's bias). In short, measurements tend to yield what it is predicted, because we just hate to be wrong, and because we are perpetually short on time and funding.
It is only when we remove the rosy glasses of presumption, that we can begin to see what was always hidden in plain sight. The challenge is to do so independent of demands for intermediate progress in never-ending efforts to obtain bridge financing.
Higher Complexity Models are unfairly preferred
"We are to admit no more causes of natural things than such as are both true and sufficient to explain their appearances" Isaac Newton
Occam's Razor is overused but the underlying principle is sound. It's a fundamental assumption that for the most part nature is conservative, and models should strive to limit the addition of dependencies. Additional degrees of freedom can always fit lower dimensional problems, but they require balancing with a penalty for each such degree introduced. Another way of looking at this is an extreme case: if I allow my parameter space to grow to the size of my data set, I can "predict" it perfectly.
A particular heuristic I refer back to handles the presence of additional degrees of freedom and is based on the Likelihood-ratio test (note that this example falls for another fallacy noted below unless used with caution). It was a balanced multiple harmonic chain fitting algorithm which fit sinusoids of varying frequency and amplitude to measured signals. For each additional sinusoid allowed, the final residuals score is penalized by the log of the total number of signals scaled by the parameter size. That way if you were just fitting noise better the algorithm wouldn't tend towards higher dimension solutions.
Drawing conclusions from drummed up data
One of the many temptations for data scientists is to fill in missing gaps in data. Interpolation is acceptable in smooth spaces, therefore functions which map data into smooth spaces are preferred. Problems arise when we are too casual with interpolations in noisy or spiky data, or even worse when we extrapolate far outside of the boundaries of a collection. Methods such as mirror wrap interpolation or zero padding exist to make filter outputs smoother near boundaries, but they should be used with caution.
Stats aren't magic, and the world isn't Gaussian
Although a beautiful theorem and appropriate to a wide variety of problems, the central limit theorem is likely the most damaging and misused theorem in the field of estimation. There are uncountably many novel noise sources and data distributions, and yet the first assumption many analysts make is that the combination of errors in measurements or features is normal. They then proceed to apply a range of statistical measures based on Gaussian distributions, Expectation-maximization, optimal predictors which are designed to reduce Gaussian noise, Quadratic Classifiers, etc.
These aren't necessarily valueless computations, in fact they may be good enough to get you in the ballpark of relatively reasonable conclusions. But using tools blindly like Quadratic Classifiers or Expectation-maximization without making an effort to understand the underlying data and noise distributions is akin to firing blind into a crowded room in hopes of hitting a bulls eye in the dark. A Pearson's Chi-Squared goodness of fit will help reveal whether a data distribution is consistent with a known density function. I've been guilty of this assumption when reviewing novel collects more times than I can remember (poor memory).
Additional Reading:
The following is a fun infographic on datamining I came across recently (source).

![]()

Ilya Grigorik writes one of my favorite technical blogs, he's got a knack for explaining complex problems in comprehensible chunks. I've been working on varied estimation and pattern matching problems for ~15 years, yet I always pick up some novel tricks or new ways of looking at pattern matching problems from visiting.
- Intuition and Data Driven Machine Learning
- Collaborative Filtering
- Support Vector Machines
- Decision Tree Learning
- SVD recommendation system in ruby
Other fun datamining reading:
- Data beats math by Jeff Jonas
- Mahout taste part 1
- Deploying a massively scalable recommended system with Apache Mahout
- Eureqa is a software tool for detecting equations and hidden mathematical relationships in your data